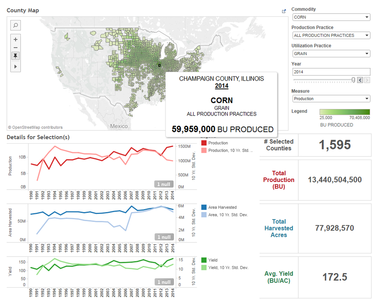
FarmPlace Ag Dashboard
The FarmPlace™ Ag Dashboard is our base-level offering providing easy access and powerful visualization of important agricultural production data.
The FarmPlace™ Ag Dashboard covers annual agricultural statistics of 19 important crops across the United States from 1990 to present, including corn, soybeans, and wheat, all using updated data from the National Agricultural Statistics Service (NASS) of the U.S. Department of Agriculture. The Ag Dashboard presents annual values and historical trends of Production, Area Harvested, Yield, and Area Planted for each crop in map and graphical form. In addition to showing data by production and utilization practices, the Ag Dashboard now shows commodity sub-classes. In fact, the Ag Dashboard now shows 133 distinct combinations of commodity, class, production practice, and utilization practice. The FarmPlace™ Ag Dashboard provides a quicker and easier way to discover agricultural data. If your business is impacted by what crops are grown where, the FarmPlace™ Ag Dashboard is for you. |
|
©2024 Ploughman Analytics. All rights reserved.


